Removing 55% of inefficiencies in the incentive authoring workflow
Enterprise SaaS
Problem Discovery
Jobs-to-be-Done
UX Strategy
Company
Cox Automotive is the world’s largest automotive services and technology provider with solutions for car shoppers, automakers, dealers, retailers, lenders and fleet owners.
Opportunity
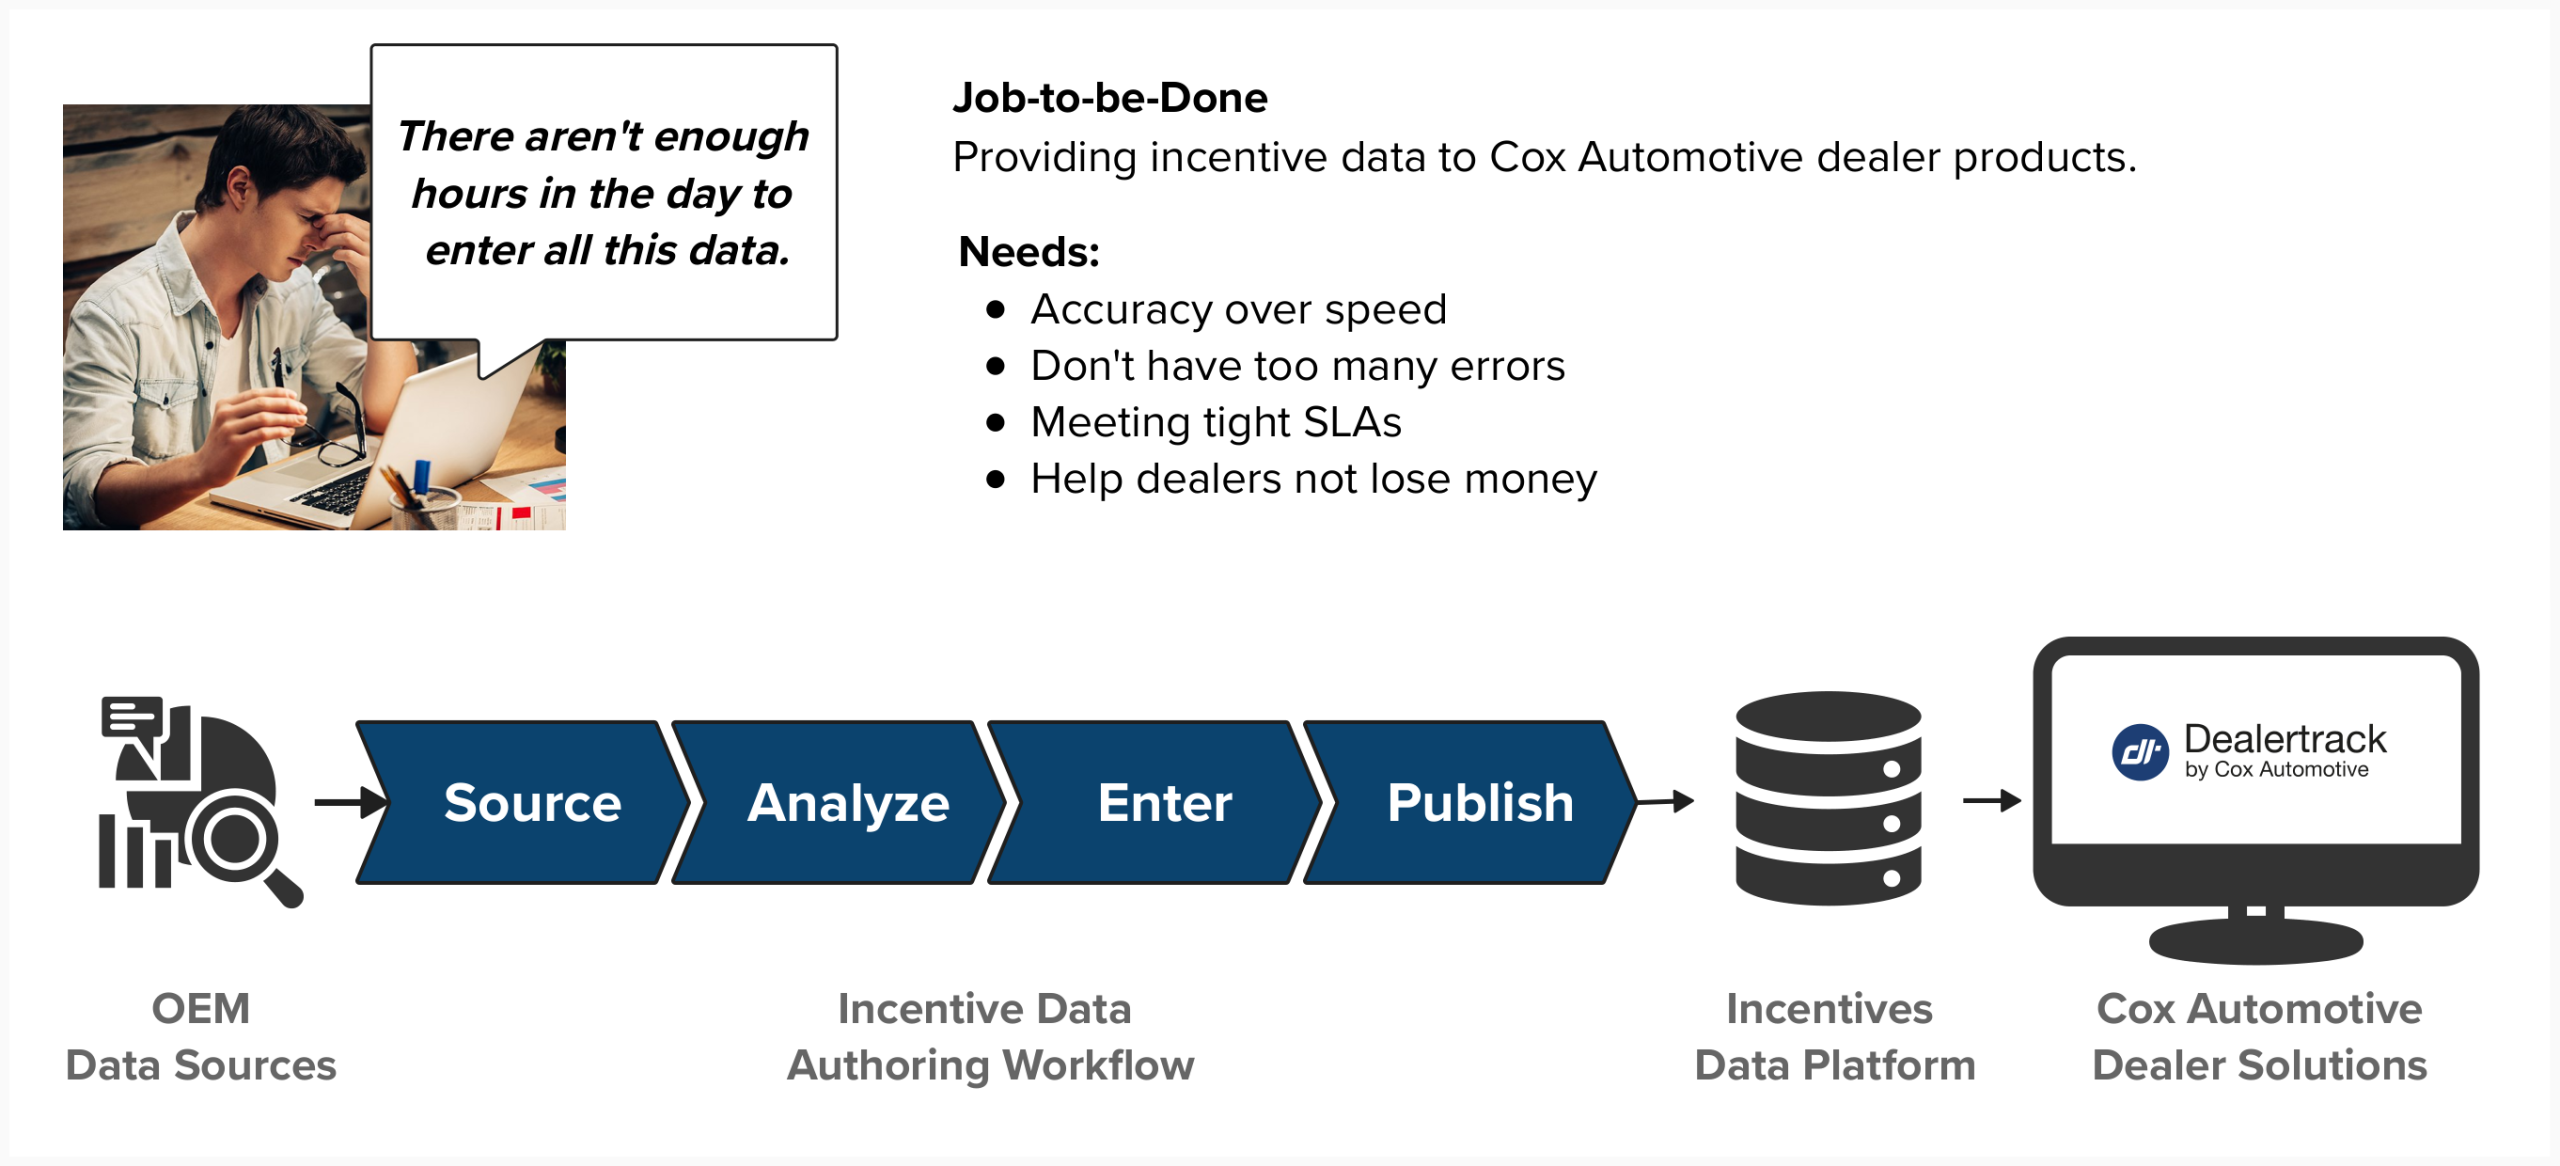
When automakers drop new incentives, our team races against the clock to make them live. However; over the years the process has been neglected and plagued with inefficiencies.
Team
> Lead UX Architect (Me) > Product Director > 2 x Platform Architect > Dir. of Product Readiness > Incentive Author
Skills & Role
> Research Plan > JTBD Personas > Job Map > User Survey > Opportunity Map
Results
-55%
Inefficiencies Eliminated
27 out of 49 high importance but low satisfaction needs met
-30%
SLA Breach Rates
Time from OEM release to Cox Automotive dealer solution system update
-25%
Erroneous Data
Monthly errors in entered data identified or reported.
Background
When automakers drop new incentives, Incentive Authors race against the clock (tight SLAs) to gather, analyze, and enter critical data into Cox’s Incentive Platform. This powerhouse fuels dealer tools that calculate payments, trade-ins, rebates, and interest rates—helping dealers close deals faster and shoppers score big savings.
However; over the years the process has been neglected and plagued with inefficiencies.
How Might We...
Identify the most critical inefficiencies in the Incentive Authoring workflow so that dealers and shoppers obtain the most up date and accurate savings
The Research Strategy
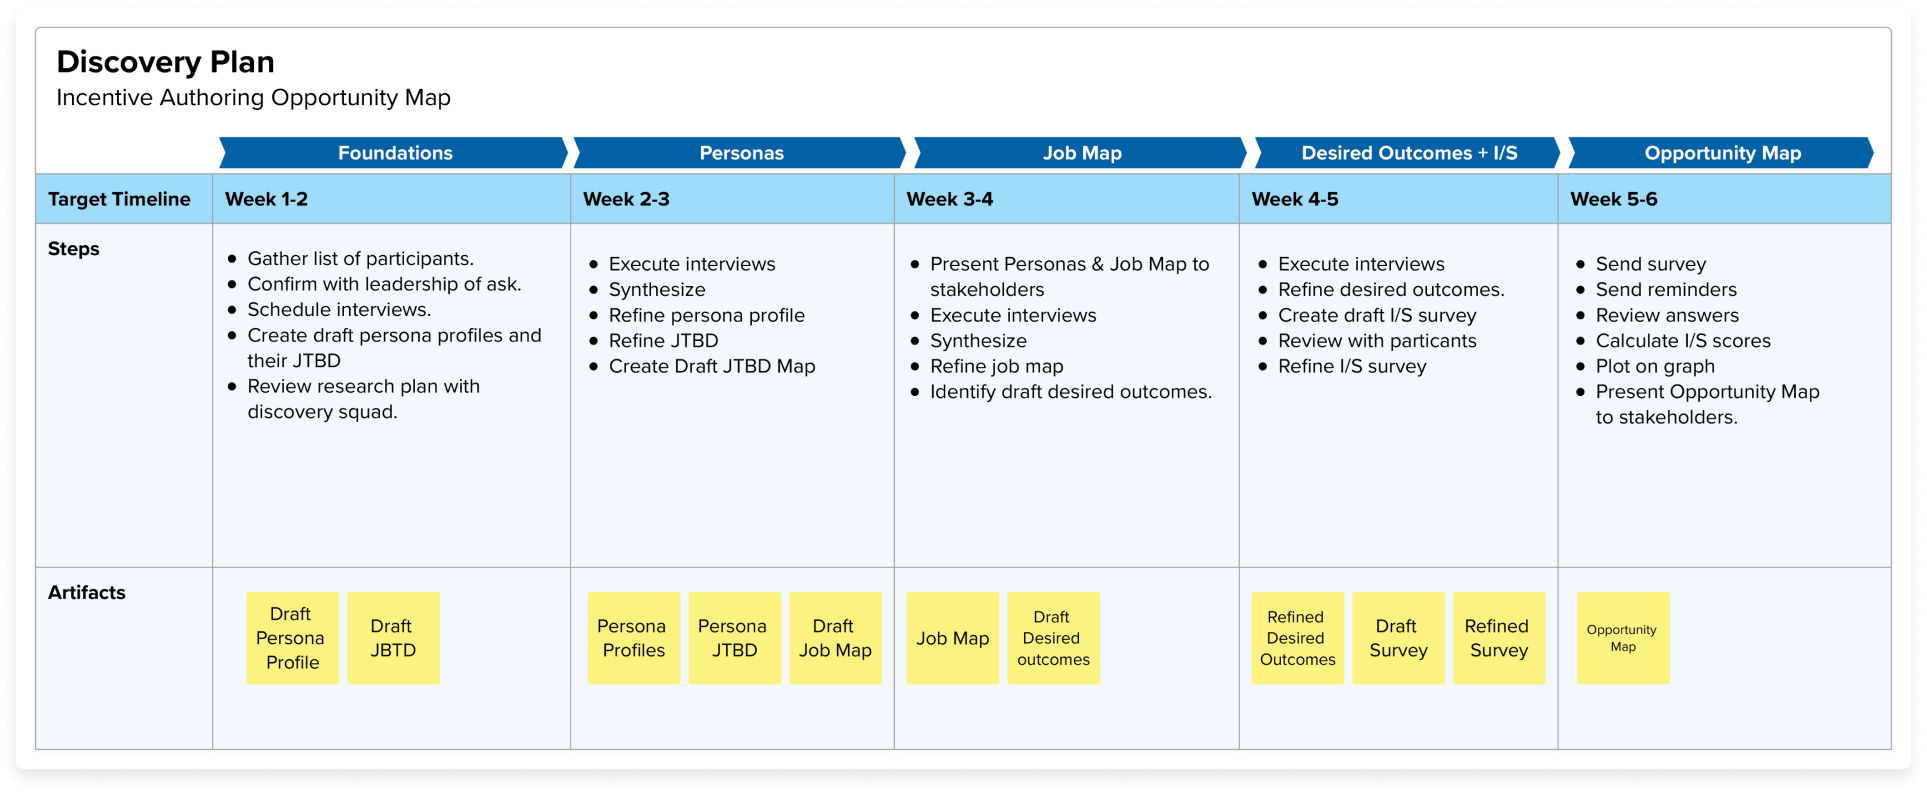
I created a JTBD-based research plan to understand user needs, identify improvements, and most importantly set expectations. After aligning with my product team and readiness manager on timelines and goals, I presented it to the Incentive Authoring team and leadership during kick-off. (See Image A)
Image B - This research plan was used to set commitment expectations for each phase.
The Incentive Author and their JTBD
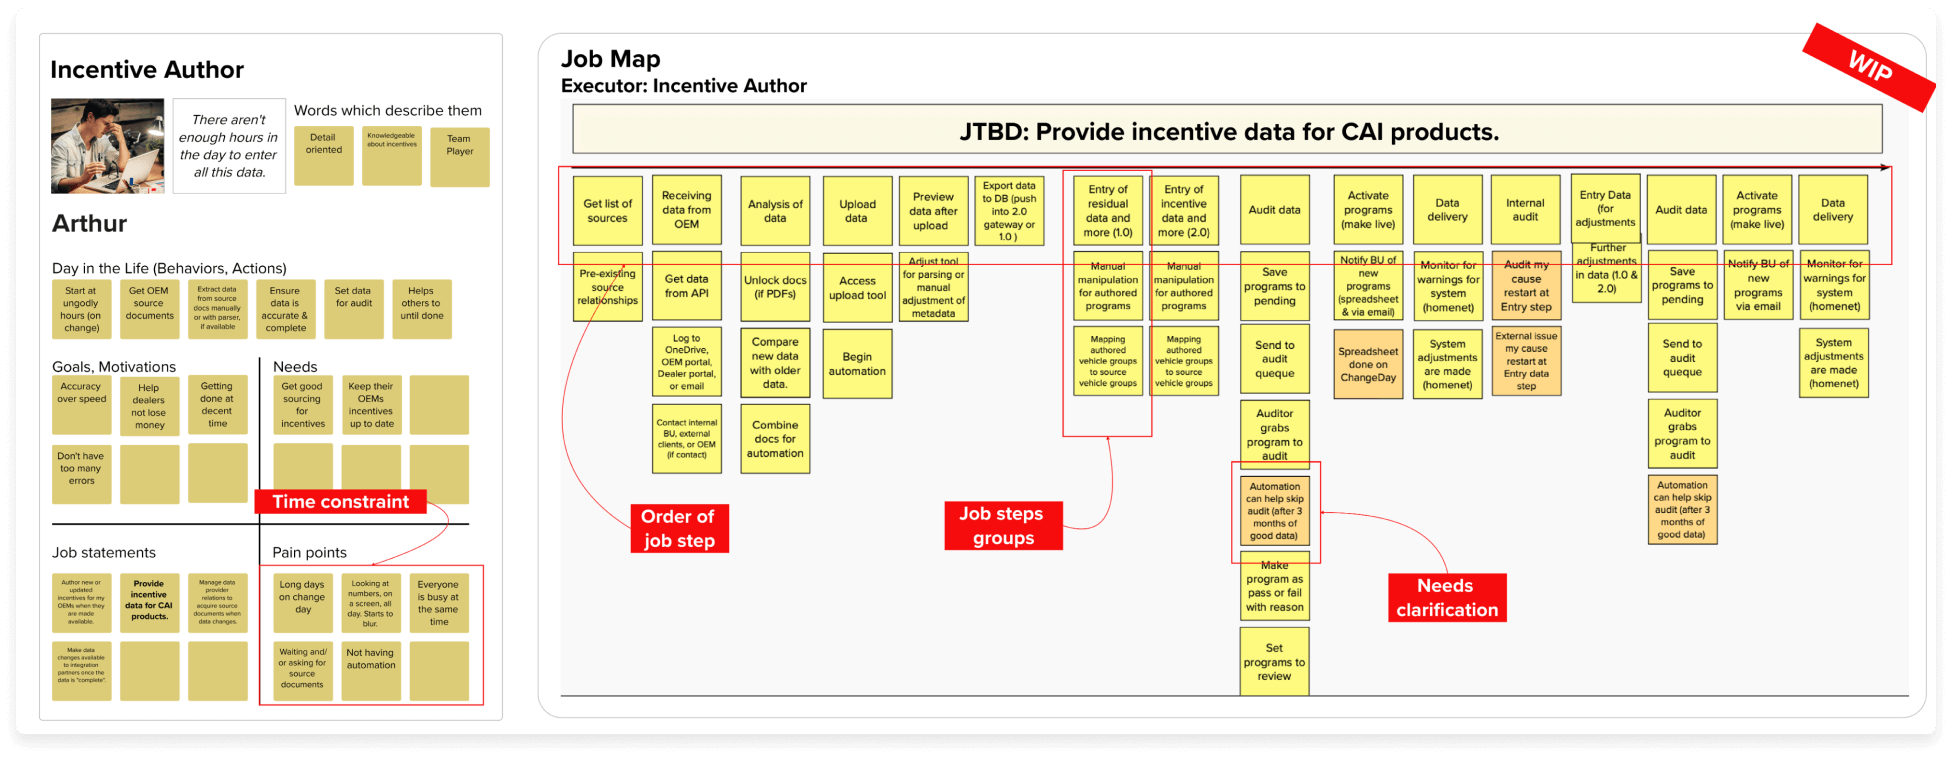
Interactive interviews ensured an archetypal understanding of the Incentive Author role and a Job Map (See Image B), the step-by-step representation of the JTBD:
Providing incentive data to Cox Automotive dealer products.
Image B - On the left, a completed user persona profile. On the right, a draft Job Map.
Expressed Pain Points
Change Day
The race against the clock to update all incentives. It starts in early morning and lasts up to 24 hours.
Limited Help
The entire incentive group is occupied with their entries during Change Day, there is limited assistance provided.
Manual Effort
OEM incentives are not consistent, limiting the ability to automate processes.
Refining the Job Map & Needs
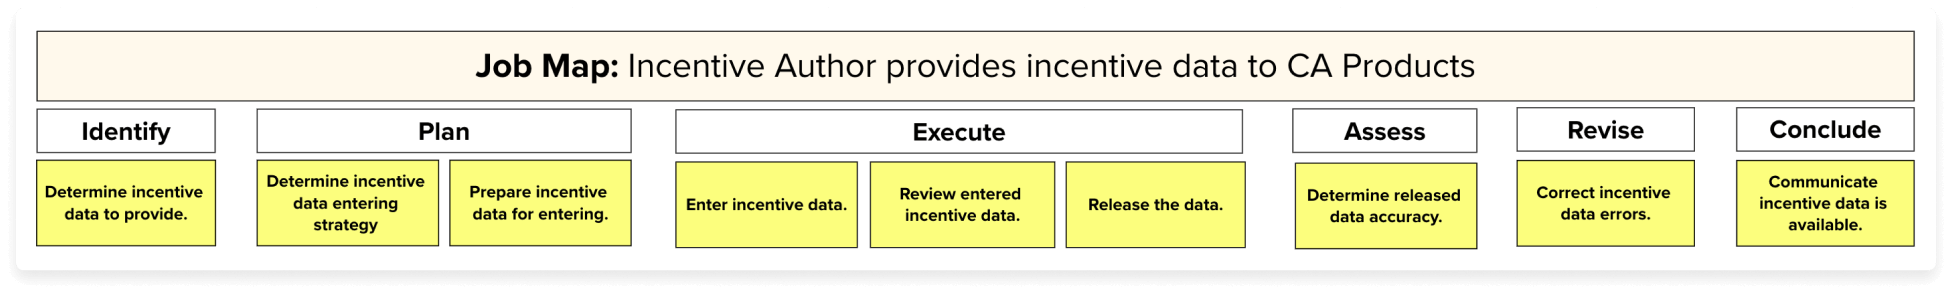
I combined all job maps from interviews and in the second round, validated steps and flagged misalignment. The exercise ensured accurate capturing of the job steps. Behind the scenes, there was much back-and-forth to ensure a good-enough but accurate JTBD representation in the Job Map (See Image C).
Job Steps
In the world of Jobs-to-be-Done, job steps are written in “Verb + Object + Contextual Clarifier” format. This ensures each step describes, with a verb, how the job executor is moving forward in the process in a clear manner until the job is concluded.
Image C - Core Job Map representation of the incentive authoring process.
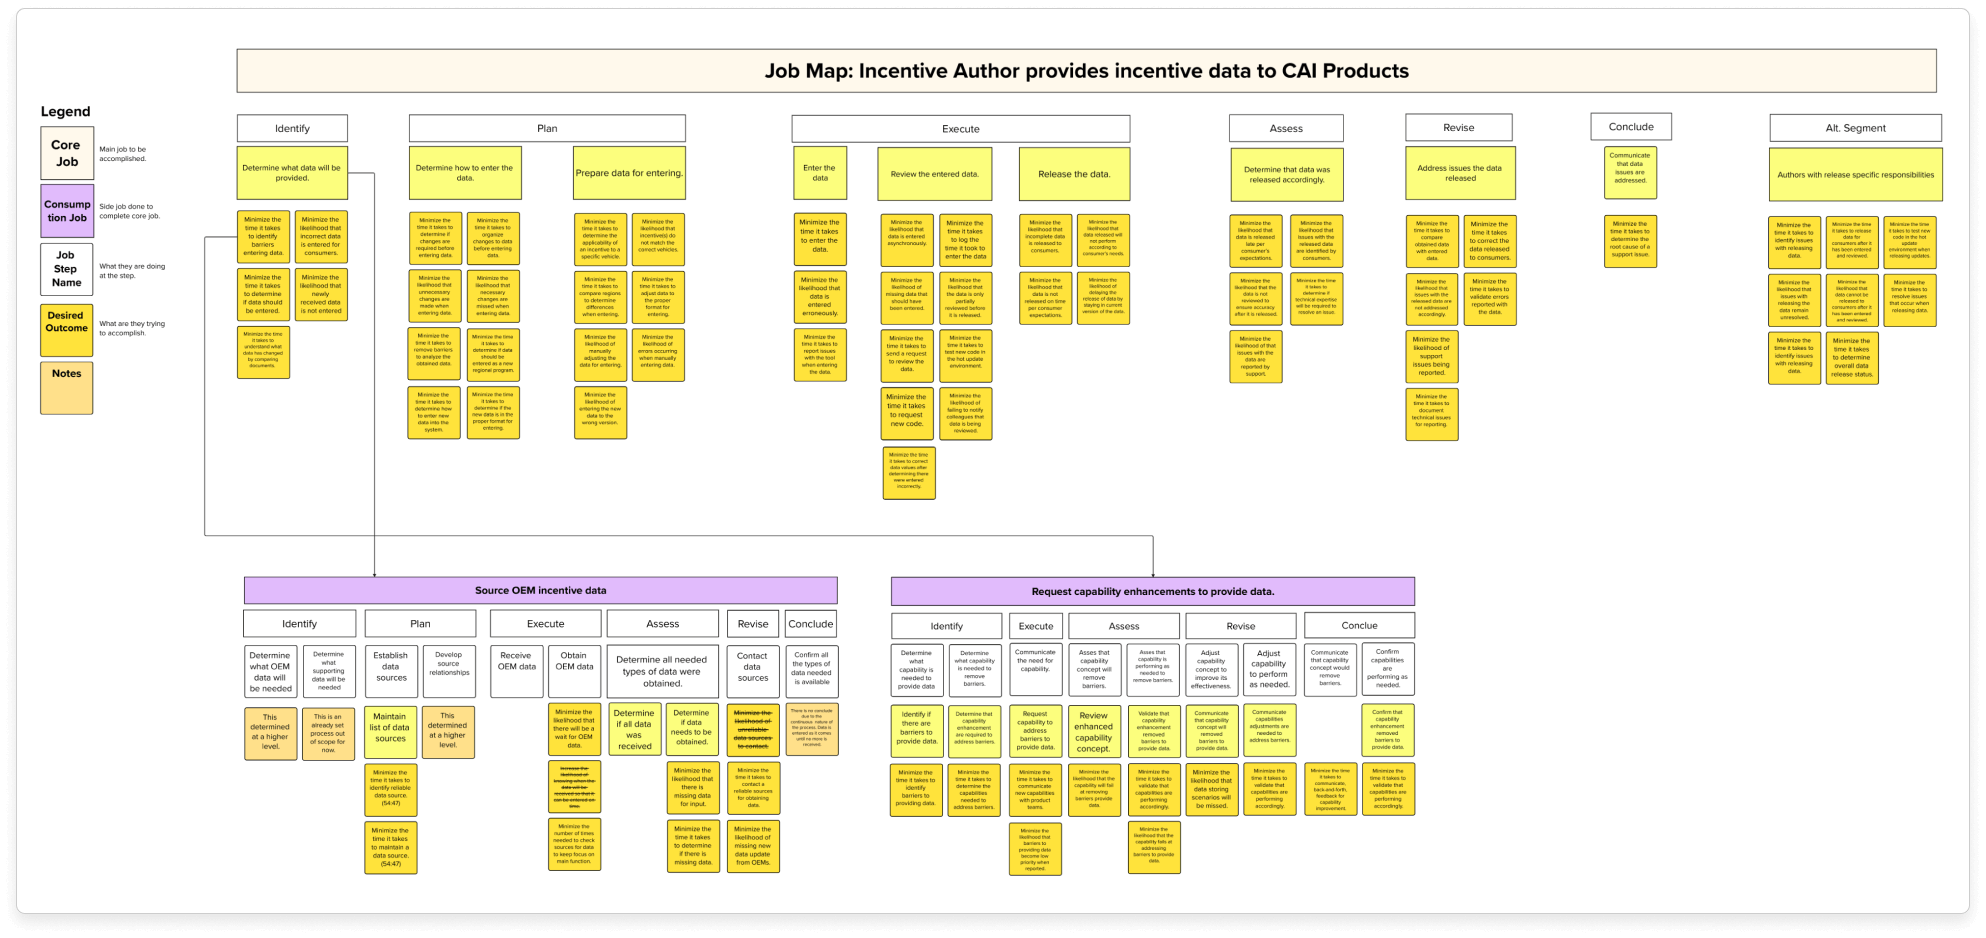
The Complete Job Map
Our JTBD research had uncovered 49 measurable desired outcomes (potential inefficiencies in the process). Each plays a role in an Incentive Author’s JTBD: Providing incentive data to Cox Automotive dealer products. How do we align 49 directions?
Image D - Job Map, the visual representation of the incentive authoring process.
User Needs => Desired Outcomes
Desired Outcomes are measurable needs that, when addressed, avoid errors, wasted time, or unpredictability results in the JTBD. Removing inefficiencies in the process improves the process, that is the JTBD philosophy.
User Need:
I need to enter incentive data accurately.
Desired Outcome:
Minimize the likelihood that erroneous incentive data is stored.
With this conversion, we can measure the number of errors in the data much easier than “accuracy”.
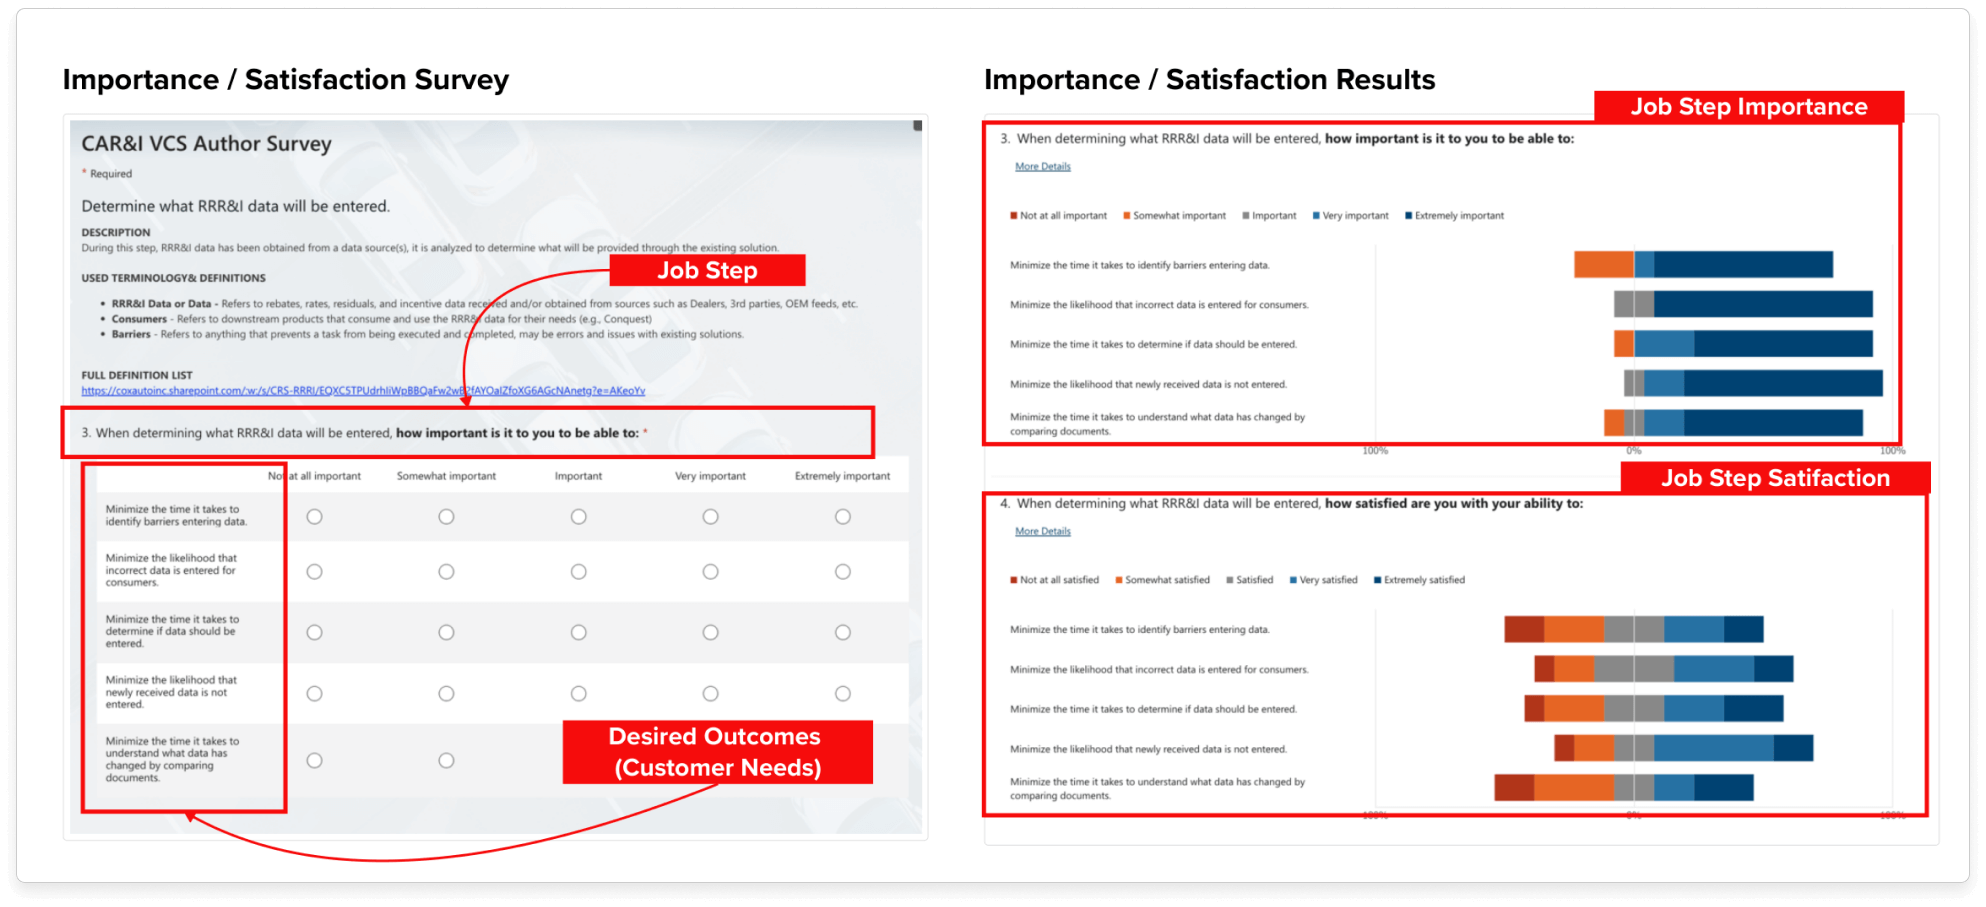
Importance vs Satisfaction Survey
Participants are given a survey that uses a likert 1-5 scale to measure the importance and satisfaction of each desired outcome. Resulting measurable feedback that we can objectively prioritize and visually represent in the Opportunity Map.
Image E - Importance vs Satisfaction survey used to measure desired outcomes.
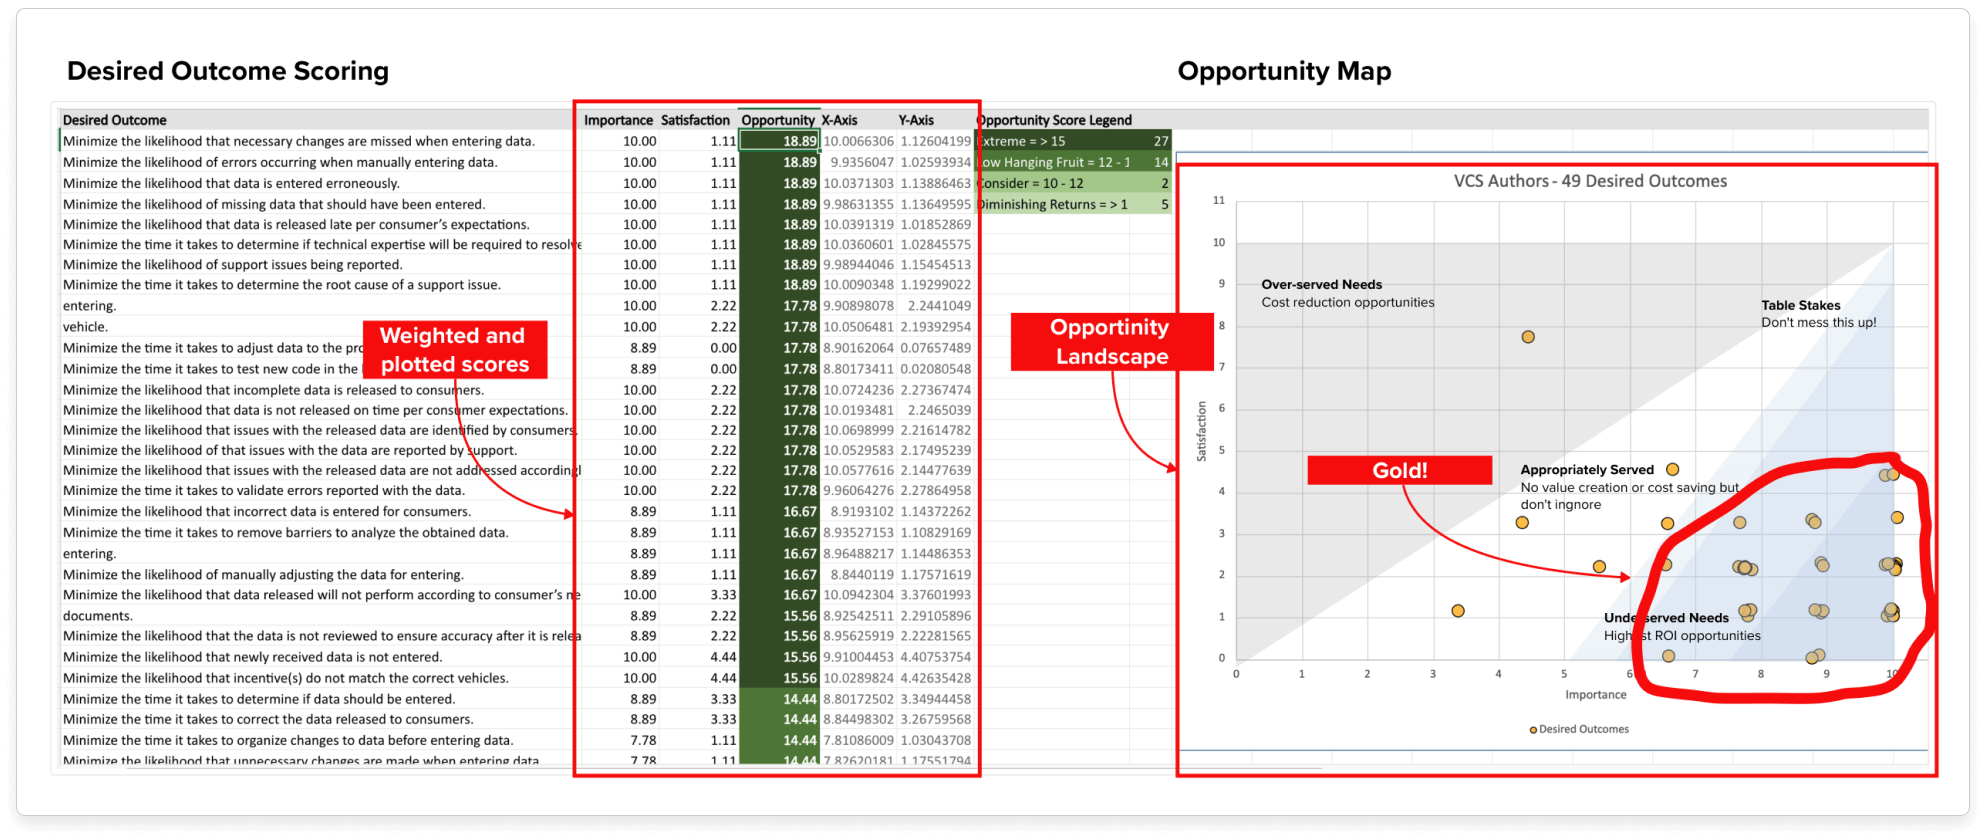
The Opportunity Map
The survey measured 49 desired outcomes. 27 out of 49 underserved. Meaning that 55% of identified needs were of high importance but low satisfaction to the Incentive Author’s JTBD. (See Image F).
Image F - Desired outcome scoring (Left) and plotting on the Opportunity Map (Right).
Conclusion
The top underserved needs revolved around identifying errors before authoring incentive data. This impacted time-to-publish and error rates. The findings influence leadership in directing investment in automation tools, process checks, and error triage that resulted in impactful improvements.
Results
-55%
Inefficiencies Eliminated
27 out of 49 high importance but low satisfaction needs met
-30%
SLA Breach Rates
Time from OEM release to Cox Automotive dealer solution system update
-25%
Erroneous Data
Monthly errors in entered data identified or reported.
Wade Wilmer
Product Readiness Cox Automotive
What sets Luis apart is his collaborative approach and ability to inspire those around him. He willingly shares his knowledge and mentors others, fostering a positive work environment. Luis's dedication, creativity, and strategic thinking make him an invaluable asset to any team
Reflection
What didn’t work?
1st Survey Attempt Failed
The first survey attempt failed. Participants expressed difficulty understanding the questions. I added context to each question and terminology definitions.
Coordinating Interviews
After failed attempts, I partnered with the Readiness Manager to schedule research participation e.g. interviews and surveys, around Change Day.
Key Takeaways
Goals vs Tasks
Mapping "Retrieve incentive data from storage" (JTBD) revealed more pain points than just asking, "How do you enter incentives?". Always frame research around user goals, not just tasks.
Measurable Impact
The I/S survey turned anecdotes into measurable insights. Critical to understanding how much to invest in process improvement.
Co-Creating with Users
Incentive Authors helped group job steps into themes, revealing overlooked workflows (e.g., "side jobs" in purple on the Job Map). Use workshops, not just interviews, to achieved shared understanding.
Leadership
Strategic Vision & Alignment
Successfully aligned stakeholders (Product Director, Readiness Manager, leadership) on research goals, expectations, and outcomes, ensuring buy-in for a data-driven approach.
Advocacy for User Needs
Led a core team and engaged Incentive Authors in co-creating Job Maps, fostering shared ownership of the problem and solution.
Cross-Functional Collaboration
Prioritized 27 high-ROI opportunities from 49 inefficiencies and presented findings to leadership, driving actionable investment decisions.
Expertise
Jobs-to-be-Done (JTBD) Methodology
Applied JTBD principles to deconstruct workflows, define job steps (Verb + Object + Context), and translate user needs into measurable desired outcomes.
Quantitative & Qualitative Research Synthesis
Designed and executed an Importance-Satisfaction (I/S) survey, analyzed Likert-scale data, and visualized insights in an Opportunity Map for prioritization.
Process Optimization & UX Architecture
Identified and eliminated 55% of inefficiencies by refining workflows, reducing manual effort, and improving data accuracy—demonstrating impact on both UX and business outcomes.